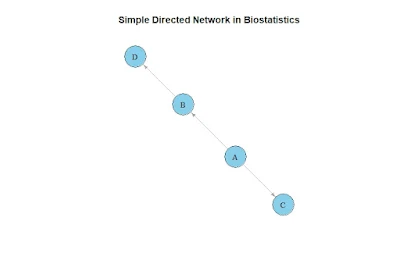
Biostatistics isn't just about numbers and p-values; it's about relationships. One fascinating way to model complex biological relationships is through Directed Networks. Whether it's the spread of a disease, gene regulation, or patient treatment pathways, directed networks allow researchers to visualize and analyze who influences whom.
In this article, we'll explore directed networks in biostatistics in a friendly, easy-to-digest way—complete with examples, tables, subheadings, and real-world applications!
 |
| Directed Network in Biostatistics |
What is a Directed Network?
A Directed Network (also known as a directed graph or digraph) is a set of nodes (points) connected by edges (arrows) where each connection has a direction. In simple terms, the relationship goes one way.
Key Characteristics of Directed Networks
- Nodes (Vertices): Represent biological entities (e.g., patients, genes, species).
- Edges (Links): Represent directional relationships (e.g., transmission of disease, regulatory influence).
- Directionality: Shows the flow from one node to another.
Example: In an infection model, Patient A → Patient B means A infected B.
Why are Directed Networks Important in Biostatistics?
Biostatistics often deals with causal relationships rather than simple associations. Directed networks help to:
- Model Cause and Effect: Identify which biological entity influences another.
- Visualize Complex Systems: Understand intricate biological pathways.
- Predict Outcomes: Simulate changes and predict effects based on the direction of relationships.
Applications of Directed Networks in Biostatistics
Directed networks are used across various fields in biostatistics. Let's look at some examples:
| Application Area | Example | Description |
|---|---|---|
| Epidemiology | Disease spread among individuals | Map who infected whom during an outbreak. |
| Genomics | Gene regulatory networks | Identify which gene activates or suppresses another. |
| Neuroscience | Neural connectivity | Model the directional firing between neurons. |
| Public Health | Patient referral networks | Understand how patients move through a healthcare system. |
| Ecology | Predator-prey interactions | Track how species impact each other's populations. |
Core Components of a Directed Network
1. Adjacency Matrix
| From \ To | A | B | C |
| A | 0 | 1 | 0 |
| B | 0 | 0 | 1 |
| C | 0 | 0 | 0 |
Interpretation:
- A points to B
- B points to C
- C points to nobody
2. Edge Weights
| From \ To | A | B | C |
| A | 0 | 0.8 | 0 |
| B | 0 | 0 | 0.5 |
| C | 0 | 0 | 0 |
Interpretation:
- A transmits disease to B with 80% probability.
- B transmits to C with 50% probability.
3. Pathways
This path shows how a disease moves through individuals.
4. Cycles
Example:
Real-World Example: Directed Network of Disease Spread
- A infected B and C.
- B infected D.
- D infected E.
Adjacency Table:
| From \ To | A | B | C | D | E |
| A | 0 | 1 | 1 | 0 | 0 |
| B | 0 | 0 | 0 | 1 | 0 |
| C | 0 | 0 | 0 | 0 | 0 |
| D | 0 | 0 | 0 | 0 | 1 |
| E | 0 | 0 | 0 | 0 | 0 |
Insights:
- Patient A is a "super-spreader" (infected two people).
- Patient C did not infect anyone else.
- Pathway: Disease flows mainly through B and D.
Tools for Directed Network Analysis in Biostatistics
R Packages
- igraph: Create and analyze graphs.
- ggraph: Beautiful network visualizations.
- tidygraph: Tidy data for graphs.
Python Libraries
- networkx: Build and analyze network structures.
- PyGraphviz: Create directed network graphs easily.
Specialized Software
- Cytoscape: Biological network visualization.
- Gephi: For large, complex networks.
Advantages of Directed Networks
- Clarify Causal Relationships: Easy to spot influence patterns.
- Identify Key Players: Detect "super-spreaders" or important nodes.
- Simulate Interventions: Test how changes affect network dynamics.
Limitations of Directed Networks
- Data Collection Challenges: Directionality is difficult to prove.
- Scalability Issues: Large networks become visually overwhelming.
- Risk of Overinterpretation: Not all connections imply causality.