Introduction
Poincare plots, also known as return maps, are powerful tools in biological sciences for analyzing time series data and understanding complex physiological processes. This guide explores how to use Poincare plots in various biological applications, particularly focusing on their construction, interpretation, and practical uses in research and clinical practice.
What is a Poincare Plot?
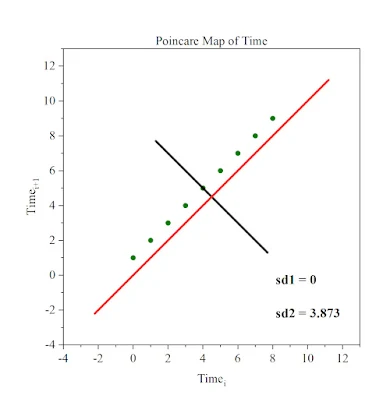
A Poincare plot is a scatter plot where each point represents a pair of consecutive values in a time series. Specifically, if you have a sequence of data points (𝑥1,𝑥2,𝑥3,…,𝑥𝑛), the plot is constructed by plotting (𝑥𝑖,𝑥𝑖+1) for 𝑖=1 to 𝑛−1. In biological sciences, these plots are often used to analyze physiological signals such as Heart Rate Variability (HRV), respiratory cycles, and other time-dependent biological measurements.
Constructing a Poincare Plot
Obtain Time Series Data:
Collect a sequence of data points from a physiological measurement. For HRV, these are the RR intervals from an electrocardiogram (ECG).
Create Data Pairs:
Form pairs of consecutive data points. For example, if the time series is (𝑥1,𝑥2,𝑥3,…,𝑥𝑛) , create pairs (𝑥1,𝑥2),(𝑥2,𝑥3),(𝑥3,𝑥4),…,(𝑥𝑛−1,𝑥𝑛).
Plot the Pairs:
Plot these pairs on a scatter plot, where the x-axis represents 𝑥𝑖 and the y-axis represents 𝑥𝑖+1.
Interpreting a Poincare Plot
Shape of the Plot:
Elliptical Shape:
Indicates normal physiological variability. A tighter, more elongated ellipse suggests reduced variability, while a broader ellipse indicates higher variability.
Complex Shapes:
Irregular or complex shapes may indicate abnormal or irregular variability, potentially signaling underlying health issues.
Quantitative Measures:
SD1 (Standard Deviation 1):
Measures the dispersion of points perpendicular to the line of identity (y = x). It reflects short-term variability.
SD2 (Standard Deviation 2):
Measures the dispersion along the line of identity. It reflects long-term variability.
SD Ratio (SD2/SD1):
The ratio of long-term to short-term variability, providing insights into the balance of these two components.
Applications in Biological Sciences
Heart Rate Variability (HRV) Analysis:
Clinical Cardiology:
Poincare plots are extensively used to assess HRV, providing insights into autonomic nervous system function and cardiovascular health. Reduced HRV and abnormal Poincare plot patterns can indicate heart disease, stress, or autonomic dysfunction.
Stress and Fitness Monitoring:
Athletes and individuals under stress can use Poincare plots to monitor their heart rate patterns, helping to optimize training and manage stress levels.
Respiratory Studies:
Breathing Patterns:
Poincare plots can analyze respiratory cycle variability, aiding in the diagnosis and monitoring of respiratory disorders such as asthma, COPD, and sleep apnea.
Ventilation Control:
In critical care, Poincare plots help evaluate the effectiveness of ventilation strategies and detect irregularities in breathing patterns.
Sleep Research:
Sleep Quality Assessment:
By analyzing HRV or respiratory rate during sleep, Poincare plots help identify different sleep stages and detect abnormalities, contributing to the diagnosis of sleep disorders like insomnia or sleep apnea.
Neuroscience:
Brain Activity:
Poincare plots can be used to analyze the variability in neural signals, such as electroencephalogram (EEG) data, providing insights into brain function and detecting abnormalities like epilepsy.
Chronic Disease Management:
Monitoring Progression:
For chronic conditions like diabetes or hypertension, Poincare plots can track changes in physiological parameters over time, aiding in disease management and treatment adjustments.
Predicting Complications:
Abnormal patterns in Poincare plots can serve as early indicators of complications, prompting timely medical interventions.
General Physiological Monitoring:
Homeostasis and Adaptation:
Poincare plots can be used to study the body's homeostatic mechanisms and adaptive responses to various stimuli, including physical activity, diet, and environmental changes.
Conclusion
Poincare plots are versatile tools in biological sciences, offering a visual and quantitative means to analyze the dynamics and variability of time series data. Their applications in HRV analysis, respiratory studies, sleep research, neuroscience, and chronic disease management highlight their value in both research and clinical practice. By leveraging Poincare plots, researchers and clinicians can gain deeper insights into physiological processes, monitor health conditions, and improve patient care. Understanding and effectively utilizing Poincare plots can enhance the analysis of complex biological data, contributing to advancements in medical research and practice.
