Introduction to Point-Biserial Correlation
In biological and environmental sciences, we often need to measure the relationship between a binary categorical variable (e.g., presence/absence of contamination) and a continuous variable (e.g., fish growth rate).
Point-biserial correlation is a special case of the Pearson correlation used when one variable is dichotomous (binary: 0 or 1) and the other is continuous.
When to Use Point-Biserial Correlation?
- Measuring the effect of pollution (High/Low) on plant growth.
- Analyzing whether disease status (Present/Absent) affects blood pressure levels.
- Checking if gene mutation (Yes/No) correlates with enzyme activity.
In this tutorial, we will simulate a dataset in R, perform point-biserial correlation, visualize the results with graphs, and interpret the findings.
Step 1: Understanding the Point-Biserial Correlation Formula
The point-biserial correlation coefficient () is calculated as:
Where:
- , = Mean of the continuous variable for each group.
- = Standard deviation of the continuous variable.
- , = Sample size for each group.
- = Total sample size.
Now, let’s generate a dataset and compute point-biserial correlation in R.
Step 2: Generate a Simulated Dataset in R
We'll create a dataset where:
- Contamination (Binary: Low = 0, High = 1) affects
- Fish Growth Rate (Continuous: cm/month)
# Load necessary libraries
library(ggplot2)
library(dplyr)
# Set seed for reproducibility
set.seed(123)
# Generate Data
n <- 50 # Sample size
contamination <- sample(0:1, n, replace = TRUE) # Binary variable: Low (0) or High (1)
growth_rate <- ifelse(contamination == 1,
rnorm(n, mean = 3.5, sd = 0.8), # High contamination group
rnorm(n, mean = 5.0, sd = 0.9)) # Low contamination group
# Create Data Frame
fish_data <- data.frame(Contamination = contamination, GrowthRate = growth_rate)
# View first few rows
head(fish_data)
Step 3: Compute Point-Biserial Correlation in R
Now, we calculate point-biserial correlation using cor.test().
# Compute Point-Biserial Correlation
cor_test <- cor.test(fish_data$GrowthRate, as.numeric(fish_data$Contamination), method = "pearson")
# Print correlation results
print(cor_test)
Step 4: Visualizing the Results
Boxplot: Fish Growth vs. Contamination Level
# Convert Contamination to Factor for Visualization
fish_data$Contamination <- factor(fish_data$Contamination, labels = c("Low", "High"))
# Boxplot
ggplot(fish_data, aes(x = Contamination, y = GrowthRate, fill = Contamination)) +
geom_boxplot(alpha = 0.6) +
geom_jitter(width = 0.2, alpha = 0.5, color = "black") +
labs(title = "Effect of Heavy Metal Contamination on Fish Growth",
x = "Contamination Level",
y = "Fish Growth Rate (cm/month)") +
theme_minimal() +
scale_fill_manual(values = c("blue", "red"))
 |
| Fish Growth vs. Contamination Level |
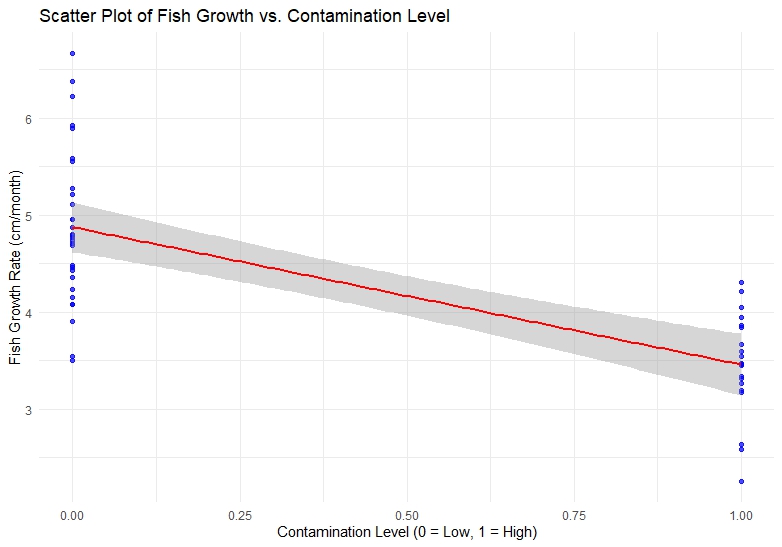
Scatter Plot with Regression Line
# Scatter Plot
ggplot(fish_data, aes(x = as.numeric(Contamination) - 1, y = GrowthRate)) +
geom_point(alpha = 0.7, color = "blue") +
geom_smooth(method = "lm", color = "red", se = TRUE) +
labs(title = "Scatter Plot of Fish Growth vs. Contamination Level",
x = "Contamination Level (0 = Low, 1 = High)",
y = "Fish Growth Rate (cm/month)") +
theme_minimal()
 |
Scatter Plot with Regression Line
|
Step 5: Additional Statistical Analysis (T-Test)
We can also perform an independent t-test to check if growth rate significantly differs between contamination levels.
# Perform Independent T-Test
t_test <- t.test(GrowthRate ~ Contamination, data = fish_data)
# Print t-test results
print(t_test)
📥 Download Sample Dataset
👉 Click here to download the fish growth dataset (Excel)
Full R Code
# Load necessary libraries
library(ggplot2)
library(dplyr)
# Simulated dataset (replace with your actual dataset if available)
set.seed(123) # For reproducibility
n <- 50 # Number of observations
# Binary variable (0 = Low, 1 = High)
contamination <- sample(0:1, n, replace = TRUE)
# Higher contamination group
# Lower contamination group
growth_rate <- ifelse(contamination == 1,
rnorm(n, mean = 3.5, sd = 0.8),
rnorm(n, mean = 5.0, sd = 0.9))
# Create Data Frame
fish_data <- data.frame(Contamination = contamination, GrowthRate = growth_rate)
# Read dataset from excel
fish_growth <- read_excel("fish_growth.xlsx")
View(fish_growth)
# View first few rows
head(fish_data)
# Convert Contamination to a factor for visualization
fish_data$Contamination <- factor(fish_data$Contamination, labels = c("Low", "High"))
# Summary Statistics
summary_stats <- fish_data %>%
group_by(Contamination) %>%
summarise(Mean_Growth = mean(GrowthRate),
SD_Growth = sd(GrowthRate),
Min_Growth = min(GrowthRate),
Max_Growth = max(GrowthRate),
Count = n())
print(summary_stats)
# --------------------
# 🔹 Point-Biserial Correlation
# --------------------
cor_test <- cor.test(fish_data$GrowthRate, as.numeric(fish_data$Contamination) - 1, method = "pearson")
# Print correlation results
print(cor_test)
# --------------------
# 🔹 Independent T-Test
# --------------------
t_test <- t.test(GrowthRate ~ Contamination, data = fish_data)
# Print t-test results
print(t_test)
# --------------------
# 🔹 Boxplot: Fish Growth Rate by Contamination Level
# --------------------
ggplot(fish_data, aes(x = Contamination, y = GrowthRate, fill = Contamination)) +
geom_boxplot(alpha = 0.6) +
geom_jitter(width = 0.2, alpha = 0.5, color = "black") +
labs(title = "Effect of Heavy Metal Contamination on Fish Growth",
x = "Contamination Level",
y = "Fish Growth Rate (cm/month)") +
theme_minimal() +
scale_fill_manual(values = c("blue", "red"))
# --------------------
# 🔹 Scatterplot: Fish Growth Rate vs. Contamination Level
# --------------------
ggplot(fish_data, aes(x = as.numeric(Contamination) - 1, y = GrowthRate)) +
geom_point(alpha = 0.7, color = "blue") +
geom_smooth(method = "lm", color = "red", se = TRUE) +
labs(title = "Scatter Plot of Fish Growth vs. Contamination Level",
x = "Contamination Level (0 = Low, 1 = High)",
y = "Fish Growth Rate (cm/month)") +
theme_minimal()
Conclusion
In this article, we explored point-biserial correlation in R, a powerful statistical method used to measure the relationship between a binary categorical variable (e.g., contamination level) and a continuous variable (e.g., fish growth rate).
Through data simulation, correlation analysis, visualization, and hypothesis testing, we gained insights into how environmental contamination affects biological growth. Key takeaways include:
✅ Point-biserial correlation provides a statistical measure of association.
✅ Graphical representations (boxplots and scatter plots) help visualize the trend.
✅ T-tests confirm whether differences between groups are statistically significant.
This method is widely applicable in biostatistics, ecology, health sciences, and genetics, making it a valuable tool for researchers analyzing binary vs. continuous relationships.